Account Balance Visualization
From this form, it is possible to obtain a view of the data on screen that roughly corresponds to the report of the trial balance, while being able to take advantage of various filtering options, data grouping, and additional options.
FILTER AREA:

This allows for filtering the accounting data to process by entering a range of posting dates, a range (subset) of accounts or detail accounts, an account type, an accounting reason (Template), a specific department (useful if there are more than one active), and a foreign currency (Valuta).
Convert also the other sums in currency: by activating this flag, in conjunction with the valuation of the previous Currency filter (which extracts movements expressed in a particular currency), other accounting movements expressed in Euro or other currencies will also be converted into the selected currency using the exchange rate on the posting date.
PARAMETERS: (open the expander)

Since the results grid also presents the Level field, which represents the hierarchical order of the respective account/detail account in the chart of accounts (where 99 is the last lower level of maximum detail possible and 0 is the root node, generally containing the total), there is a filter on the levels to display:
All: shows all levels;
Show totals for level X...: by entering the desired level (example 98) in the adjacent Level field, the results will be grouped by master account (which in the chart of accounts is the level immediately above 99, defined for the purposes of this processing as the maximum detail of detail accounts in the chart of accounts);
Show totals for level X... with subtotals: compared to the previous grouping type, it will also show the subtotals of the possible hierarchically lower groupings.
Show only totals for detail accounts: values will be displayed only for levels containing detail accounts (hierarchically superior levels will not be displayed).
Exclude zero rows: accounts/detail accounts with no movements will not be displayed.
Add (off/on): the flag activates or deactivates a specific display mode that, in the event of a modification of the posting date range and updating the view by pressing the Search button again in the ribbon bar, adds the new result (appending it to the results grid) to the previously displayed one, allowing, for example, to make value comparisons between different periods. For manageability and clarity of the result, it is recommended to use this mode only in conjunction with the filter on accounts/detail accounts set to return a limited data set.
RESULT GRID:
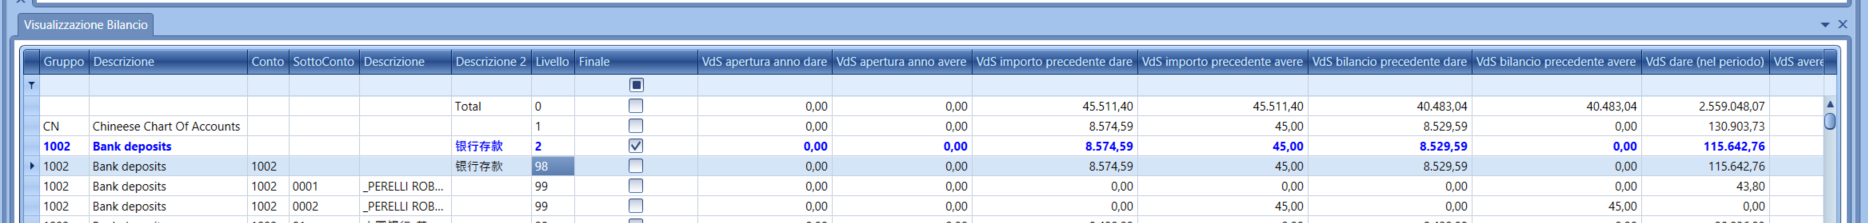
In this grid, accounts/detail accounts are displayed according to the filtering and grouping parameters defined at the top of the form.
Both the code and description of the Group (see the structure of the chart of accounts) and of the account/detail account and the code of the Level defined specifically for this processing and previously described are reported.
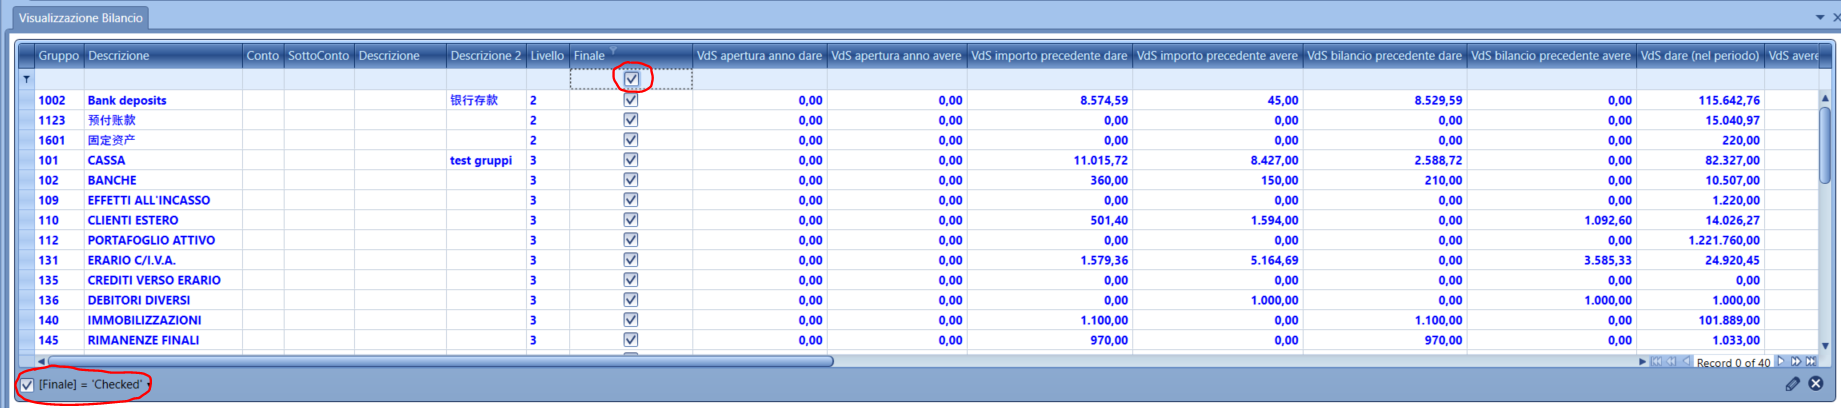
Final: this field indicates (with a flag) whether the account and/or group is hierarchically superior to all others in its branch (of the chart of accounts structure). This is useful because, in case of non-optimal or not perfectly homogeneous organization of the structure of the chart of accounts, the code displayed in the Level field may not be the one hierarchically superior, and therefore it may not be possible to filter correctly (and obtain correct totals).
Thus, in the filter row of the grid, it is possible to choose all accounts with the Final flag active, ensuring that all upper levels are extracted.
NOTES:
In the columns where numeric data is displayed, the following abbreviations are used:
VdS = Company Currency (intended as the currency of the company in use, that in which the accounting we are keeping is denominated; in the case of an Italian company, it is the Euro).
VS = Selected Currency in the initial filter.
Euroam = Euro amount: countervalue in Euro of a transaction in currency.
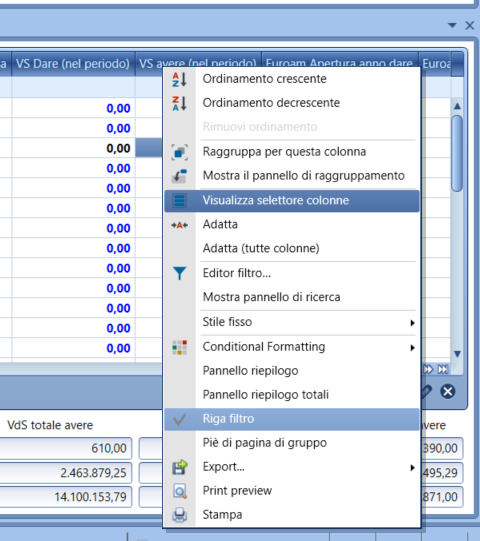
WARNING: it is possible to display (or hide) additional columns compared to the standard profile of the form by right-clicking on the headings of the grid columns and selecting Show Column Chooser.
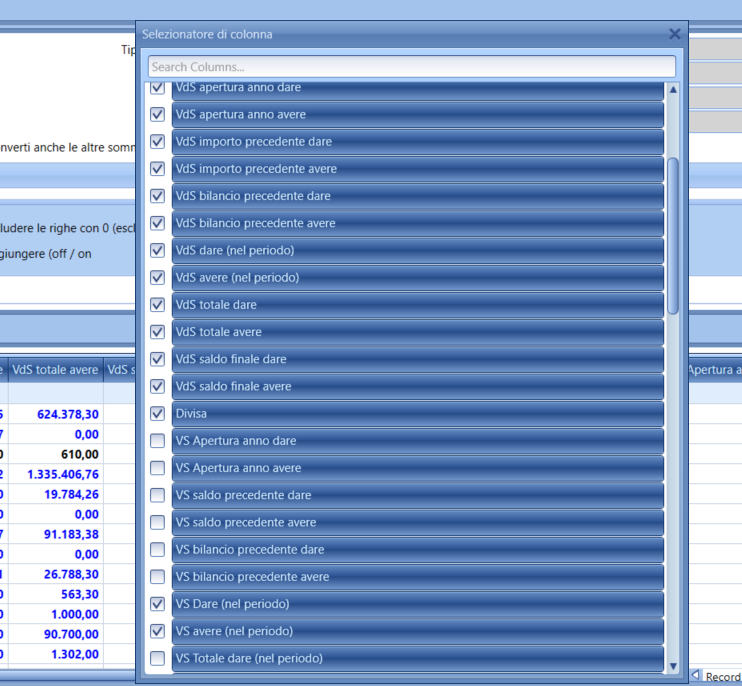
COLUMN MEANING:
Year Opening Debit / Credit = value of the last opening of accounts calculated (A)
Previous Amount (Debit / Credit) = amount referring to the period between the last accounts opening (A) and the start date of the period set in the filter for posting dates (B)
Previous Balance (Debit / Credit) = (A) + (B)
Debit / Credit in the period = amount referring to the period entered in the filter for posting dates (C)
Total Debit / Credit = (A) + (B) + (C)
Final Balance Debit / Credit = the net balance of the total debit/credit values expressed in the previous point.
Filter Column: this is a "technical" data point that serves, in case of data export of the grid to Excel (or transfer with copy-paste), to correctly manage the subsequent creation of pivot tables in Excel (this data must also be brought to Excel).
TOTALS:

Total selected rows: it is possible to select one or more (holding down the Ctrl key) accounts/detail accounts. In this case, the amounts will be totaled in this row.
WARNING: In cases where, for example, detail accounts and their related master accounts, or groups of hierarchically superior levels (which already include the values of detailed detail accounts), are selected, the amount displayed in this row will be shown in red to highlight that the total will be distorted by a non-homogeneous and coherent selection.
Total det.accounts: the totals displayed in this row refer only to detailed detail accounts of lower hierarchical levels.
Total table: the totals displayed in this row refer to all the rows displayed in the results grid, so if both detailed detail accounts and higher accounts or levels are returned (based on the set filters), the total will be the sum of the detail accounts and the higher levels (multiplying the values relative to the level of detail and representing, in this case, a data point that is not very significant).